| Chapter 3. GraphiCAD | ||
|---|---|---|
 |
 |
|
| Chapter 3. GraphiCAD | ||
|---|---|---|
| |
|
|
Table of Contents
 |
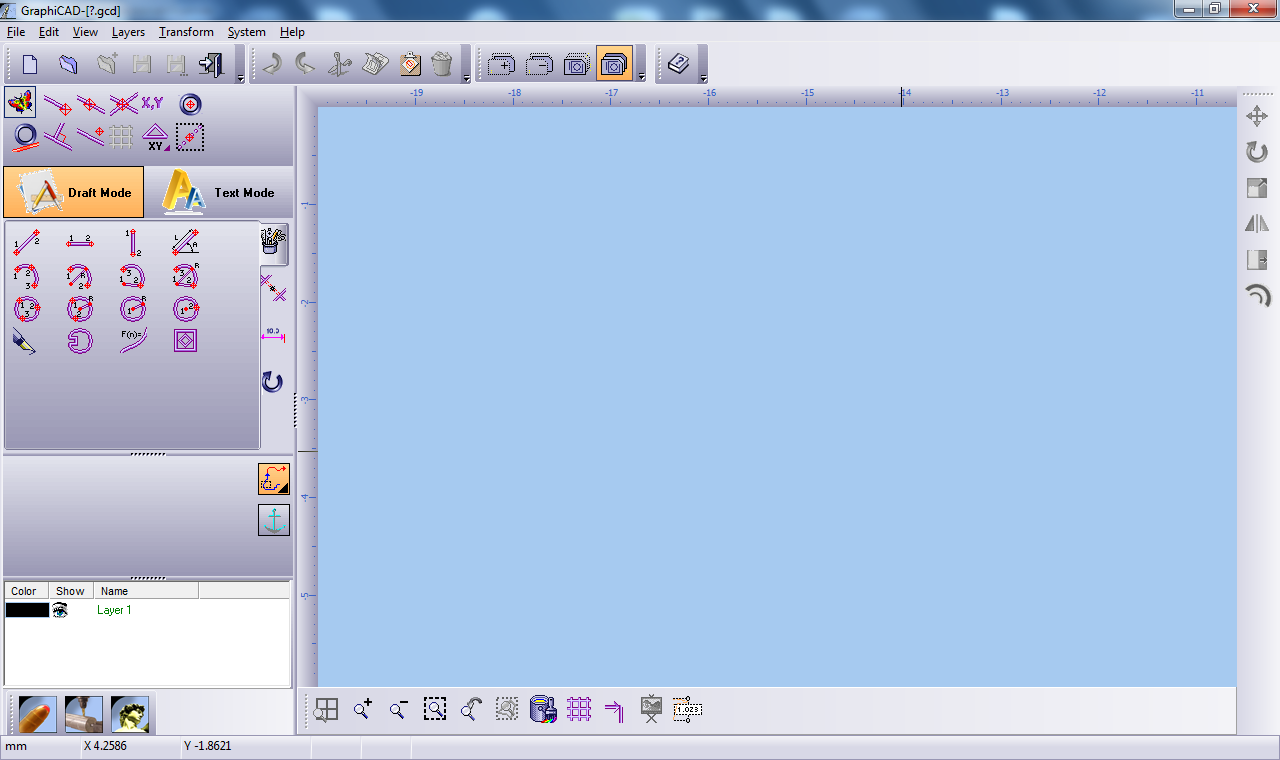
Title bar: Displays the name of the file you are working on. |
 |
|
 |
Main menu: Contains system commands, which are listed in the form of drop-down menus. |
 |
Toolbars: These are shortcut areas, where you are able to add or delete icons from the defaulted list provided. |
 |
Work area: Where editing of text and geometries are done. |
 |
Group manager: In addition to the menu, many operations can be performed directly in the Layer Manager area. |
 |
System toolbar: Enables you to open other modules, and to cut copy and paste objects between them. |
 |
View toolbar: Shortcut buttons for the menu. |
 |
Status bar: The application interaction area with the user. Displays varied information as system units, mouse cursor position etc. |
 |
Cursor Pick Type: Specifies the type of cursor and operation you are working with. |
 |
Draft/Text toggle button: This toggle button toggles between text and draft mode. |
 |
Tools panel: The main drawing and writing tools of the GraphiCAD module. The Drawing and Verification Tools will vary according to the toolbox selected. |
 |
Message panel: When user input is needed , it will appear in this area. |
 |
Marking modes: Switch between marking modes. |
 |
Anchor: Change marked elements reference point. |
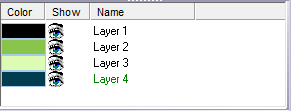
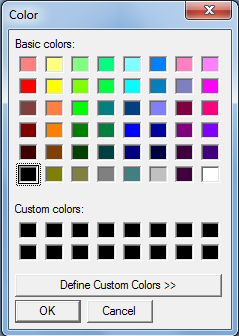
| Color | When selecting a new layer, a color is automatically
chosen for you. If you decide to select your own representative color
for a layer, select the colored bar for the relevant layer:
 |
|||
| Show | Enables you to select the layers you want displayed on an image. Ensure is selected from the Menu; all the eye icons will be open. To hide or reveal a layer, click on the eye icon. A closed eye icon means the layer is hidden. | |||
| Name |
To make a layer active click on the layer's name; the layer will be highlighted meaning it is active. To change a layer's name right-click, and select from the menu.
|
|
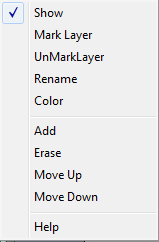
Ensure the layer you want to display is highlighted, and select Show. To hide a layer, click on the eye icon. Show is a toggle switch operated by clicking on the eye icon. |
|
|
Mark all entities within the highlighted layer. |
|
| Un Mark all entities. | |
| Change group name. | |
| Change Color. | |
| Adds a new layer. | |
| Erase the current layer. All entities in this layer will be deleted (you will be prompted to confirm this action if entities are going to be deleted). | |
| Enables you to move the highlighted layer up by one layer. The alteration in layers occurs both in the order of the group manager and visibly in the image. This function is useful when layer images overlap each other. | |
| Enables you to move the highlighted layer down by one layer. The alteration in layers occurs both in the order of the group manager and visibly in the image. This function is useful when layer images overlap each other. | |
| Opens the help file. |
Abstract
The tools panel contains the essential tools for handling geometries.
When the Draft/Text toggle button reads , the tools panel is divided into 4 tabs:
 |
Contains the main drawing features of the GraphiCAD module. It enables you to construct single geometric elements. The drawing commands are repetitive and are terminated by pressing Esc or making a new selection. |
 |
Contains a number of refining tools to ensure a more precise image. In addition it contains a search function to detect potentially problematic parameters. |
 |
Measures and, if required marks various dimensions of an image. |
 |
Enables the fine-tuning and adapting of the geometric design. |
When the Draft/Text toggle button reads , the tools panel shows the text parameters and tools.
 |
The sketch function enables you to digitize a contour. You can select any clicking option (Free, End Entity, Mid, Center, Grid) to create continuous connected entities. Figure 3.2. Sketch Dialogue 
|
 |
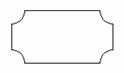
Using hole library is practical when common geometries with a difference in dimensions must be drawn. You can create a library of commonly used holes. These holes can be loaded when necessary, speeding up your drafting tasks. Two common geometries are supported in the GraphiCAD module:
(both used mainly for electronic panels).
Figure 3.3. Hole Library, Obround. 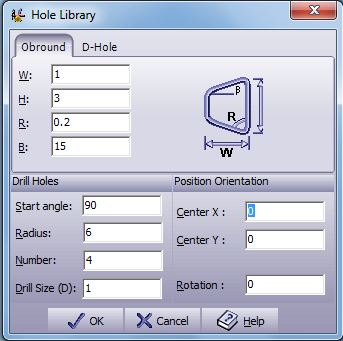
Hole dimensions are defined according to the schematic drawing in the dialog box. Press to produce the holes. Press to exit without changes. Press to enter the On-line Help. In a similar manner, select D-Hole to set D-Hole parameters according to the D-Hole diagram. Select the D-Hole tab to define D-hole parameters. Figure 3.4. Hole Library, D-Hole. 
|
|||||||||||||||||||||||||||||||||||||||||||||||||||||||
 |
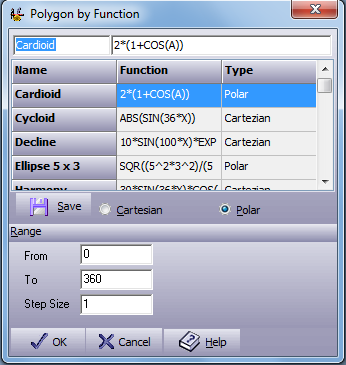
This function enables you to generate a polyline based on a mathematical function. A basic knowledge of mathematics is required. Press this button to open the dialog box below.
|
|||||||||||||||||||||||||||||||||||||||||||||||||||||||
 |
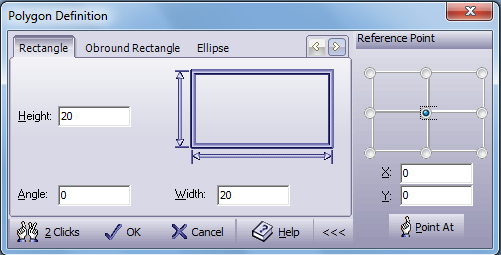
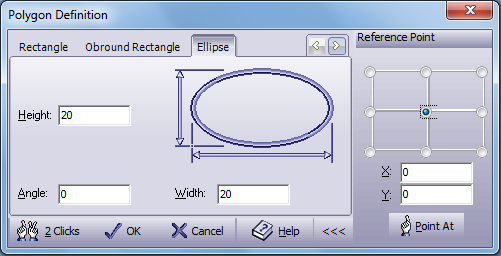
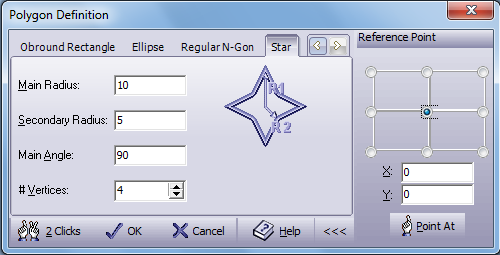
Open the polygon definition dialog box and enter the relevant values for the parameters. You can select from five tabs:
Below is an example of the dialog box for the creation
of a rectangle. This includes the display of the advanced features,
which is activated by selecting the advanced mode button The advanced feature section appears in all five
polygon definition modes: The location of the reference point relative
to the frame defined by the nine radio buttons, and the absolute
location of the reference point on the job’s screen. Select
the absolute point by entering the coordinate values in the X,Y
edit boxes, or press Rectangle .
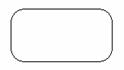
Obround Rectangle . Draw a rectangle with blended corners by defining height, width, radius and position.
Ellipse . Draw an ellipse by defining height, width, angle and position.
Regular N-Gon . Draw a polygon by defining radius, number of vertices and position.
Star . Draws a star by defining 2 radii, a rotation angle and the number of vertices.
|
 |
Click on the element to be trimmed. A second click selects the entity that will trim the first entity. | |||
 |
Select the two entities you want to trim. | |||
|
|
Erase the picked entity/chain that lies between two intersections or end points. Click on the parts to be trimmed. | |||
 |
If pressed, the system will show all the possible solutions. Moving the cursor over the possible solutions will highlight the solution beneath the cursor in a thick drawing. Clicking on the highlighted solution will select it. Example. Trimming arcs or against circular entities, several trimming possibilities are enabled. If this occurs, the most likely result is performed. Figure 3.13. Multiple Select Mode Trimming an Arc 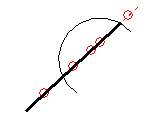 Any of the small circles represents one of the possible solutions for the trimming operations. |
|||
 |
Trim and round a corner at the same time so that an arc replaces the corner. The blend radius dialog box appears and enables you to enter the radius value of the arc to round the two segments. Place a check mark in the box Automatic Trimming. Figure 3.14. Blend Radius Dialog  To blend a corner, click on the first element and then on the second element to be trimmed and rounded. |
|||
 |
Chamfer between two entities. The chamfer dialog box will open, enabling you to define the distance of the chamfer’s end points from the intersection point. You can also select whether you want Automatic Trimming of the entities after chamfering. Figure 3.15. Chamfer Specified Length Dialog  After you have finished entering the value, point and select the two entities between which you want to create a chamfer. The two entities must have at least one intersection point (real or virtual). You will be prompted to select the desired chamfer you want by clicking on it with the mouse. If you select Automatic Trimming and there is no real intersection point, the entities will be enlarged until they reach the chamfer location. |
|||
 |
Break a chain or an entity using three different modes: Distance, Sections and Manual. Figure 3.16. Break Entity Dialog 
Distance: Enter the distance in units (mm, inch) of each break. The distance is calculated from the end point of the entity or chain. Sections: Enter the number of sections you want the entity or chain broken into. Manual: Click on the image the areas where you want to break the entity or chain.
|
|||
 |
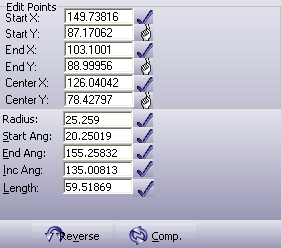
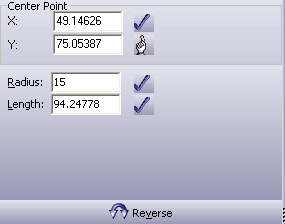
Verify and edit the different parameters of primitive entities you have created (lines, arcs and circles). The edit box then opens, displaying the current parameter values of the selected entity.
You can change any value by entering a new value in the
chosen parameter edit box and pressing the You can also change some parameters directly on screen
by selecting This editing tool enables you to select and edit similar entities, such as two lines. The selection is accomplished by pressing Ctrl while selecting an entity. After selecting the entities you wish to edit, all changes you perform in the edit dialog box will apply to those entities. In the Edit dialog box you can also reverse the direction of the selected entity and in the case of arcs you can also get the complementary arc of the one selected. |
|||
 |
The Searcher has the ability to find and correct overlapping vectors, disconnected chains and looped entities. Mark intersections and reduce the number of entities in the file. When activated the following dialog box appears:
Figure 3.18. Searcher Dialog  Press the
Auto Fix: Selecting this option and then selecting Process automatically corrects the selected options. Statistics. The right side of the window shows a tree diagram of all the drawing contents, sorted by type (lines, arcs, circles, characters, text lines, text paragraphs), organized in layers and summarized. You can expand any tree branch by clicking the [+] sign at the base of the branch, or collapse it by clicking the [-] sign. |
 |
Display the horizontal measurement of an entity onto an image. A measurement can only be taken from the end point of an entity. To operate this function 3 Clicks are needed:
Below is an example of how the horizontal measurement of a polygon is displayed. Figure 3.22. Horizontal Measurement Example 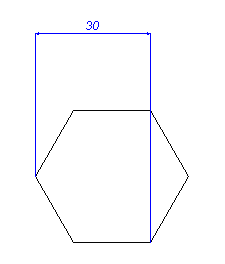 To enter alternative text or figures to the measurement on the diagram, press the Esc key to exit measurement mode. Double-click the measurement line and enter the desired text in the text box. Press Enter to display alteration.
|
|||
 |
Display the vertical measurement of an entity onto an image. A measurement can only be taken from the end point of an entity. To operate this function 3 Clicks are needed:
Below is an example of how the vertical measurement of a polygon is displayed. Figure 3.23. Vertical Measurement Example 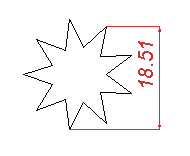 To enter alternative text or figures to the measurement on the diagram, press the Esc key to exit measurement mode. Double-click the measurement line and enter the desired text in the text box. Press Enter to display alteration.
|
|||
 |
Display the length of an entity onto an image. A measurement can only be taken from the end point of an entity. To operate this function 3 Clicks are needed:
Below is an example of how the length measurement of a rectangle is displayed. Figure 3.24. Length Measurement Example 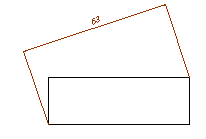 To enter alternative text or figures to the measurement on the diagram, press the Esc key to exit measurement mode. Double-click the measurement line and enter the desired text in the text box. Press Enter to display alteration.
|
|||
 |
Display the radius of an arc or circular entity onto an image. A measurement can only be taken from the end point of an entity. To operate this function 2 Clicks are needed:
Below is an example of how the radius measurement of an arc is displayed. Figure 3.25. Radius Measurement Example 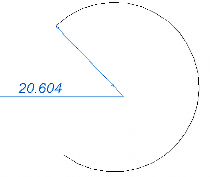 To enter alternative text or figures to the measurement on the diagram, press the Esc key to exit measurement mode. Double-click the measurement line and enter the desired text in the text box. Press Enter to display alteration.
|
|||
 |
Display the diameter of a circular entity onto an image. A measurement can be taken anywhere on the edge of the circle. To operate this function 2 Clicks are needed:
Below is an example of how the diameter measurement of a circle is displayed. Figure 3.26. Diameter Measurement Example 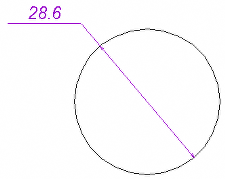 To enter alternative text or figures to the measurement on the diagram, press the Esc key to exit measurement mode. Double-click the measurement line and enter the desired text in the text box. Press Enter to display alteration.
|
|||
 |
Display the angle measurement of two connected entities. The angle is measured in an anti-clockwise direction. To operate this function 3 Clicks are needed:
Below is an example of how an angle measurement is displayed. Figure 3.27. Angle Measurement Example 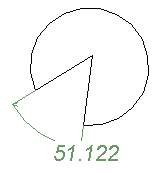 To enter alternative text or figures to the measurement on the diagram, press the Esc key to exit measurement mode. Double-click the measurement line and enter the desired text in the text box. Press Enter to display alteration.
|
 |
Vertical length (in units) of a capital letter in the selected font. This is known as the typical height. | |||||||||||||||||||||||||||||||||||||||||
 |
The ratio of the character height to width in the selected font. An aspect ratio of one maintains characters at the original size. Values greater than 1 make letters wider, and values less than 1 make letters thinner. Negative values create a mirror image of the letter. | |||||||||||||||||||||||||||||||||||||||||
 |
This value is added to the automatic kerning calculation. | |||||||||||||||||||||||||||||||||||||||||
 |
The distance between letters can be defined as constant, proportional, or kern methods.
|
|||||||||||||||||||||||||||||||||||||||||
 |
Define the slant of the letters. Positive values up to 45° slant characters to the left. Negative values slant characters to the right. A value of zero puts characters in the default upright position. Values may range from -45° to +45°. | |||||||||||||||||||||||||||||||||||||||||
 |
Rotates each character separately. The rotation angle is measured in degrees and is used mainly in non-horizontal text lines. | |||||||||||||||||||||||||||||||||||||||||
 |
This parameter changes the size of the blank between the words. The parameter is expressed in percentage where 100% means full blank size that is equal to the typical height. | |||||||||||||||||||||||||||||||||||||||||
 |
This parameter changes the next line direction (i.e. left-to-right, right-to-left, top-to-bottom, etc.). The line direction is measured in degrees. Mark the complete line to change an existing line's direction. This parameter is paragraph oriented, i.e. you must start a new paragraph in order to put this parameter into effect. | |||||||||||||||||||||||||||||||||||||||||
 |
Sets the distance between lines. The distance is between two consecutive lines, relative to their text bottom guideline. The line that holds the text cursor defines the origin from which the line distances will be measured. From this line, previous lines will move up and next lines will move down. | |||||||||||||||||||||||||||||||||||||||||
 |
Display the font dialog pick box. The current font name is displayed. | |||||||||||||||||||||||||||||||||||||||||
 |
Incorporates altered parameters to marked text. | |||||||||||||||||||||||||||||||||||||||||
 |
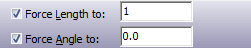
Mark the text you want to alter. Select one of the available text parameters, by clicking in its text box. Drag the cursor in the Work Area to the location / height / angle, you require. | |||||||||||||||||||||||||||||||||||||||||
 |
Reset all the text parameters as listed in → . | |||||||||||||||||||||||||||||||||||||||||
 |
Copy and apply text parameters to alternative text. Place the cursor in the text area containing the parameters you require; the text parameters are displayed in their text boxes. Click on the Copy/Apply icon. Drag a rectangle around the text you want to adapt. Release the mouse button; the marked text will incorporate the new text parameters. | |||||||||||||||||||||||||||||||||||||||||
 |
Align left. Figure 3.28. Align Left Example. 
|
|||||||||||||||||||||||||||||||||||||||||
 |
Align right. Figure 3.29. Align Right Example. 
|
|||||||||||||||||||||||||||||||||||||||||
 |
Align to center. Figure 3.30. Align To Center Example. 
|
|||||||||||||||||||||||||||||||||||||||||
 |
Aligns all the marked characters along the tops of the characters. Figure 3.31. Justify Top Example 
|
|||||||||||||||||||||||||||||||||||||||||
 |
Aligns all the marked characters through the center of each character. Figure 3.32. Justify Middle Example 
|
|||||||||||||||||||||||||||||||||||||||||
 |
Aligns all the marked characters along the bottoms of the letters. This is the default alignment for the system. Figure 3.33. Justify Bottom Example 
|
|||||||||||||||||||||||||||||||||||||||||
 |
Aligning paragraphs into frames is useful when positioning several text groups on the layout. The marked text is aligned to the active frame. Upon selecting this option from the command bar, the following dialog box appears: Frame Alignment dialog box contains one parameter to be specified out of nine options. A radio button specifies the parameter. Three types of alignment are possible: Scale, Stretch, and Spaces, and Center. Scale . This option changes the total scale of the text, keeping all the proportions between text size and space unchanged. The scale can be changed to fit the frame's width or height, or to center the text to the frame without changing its scale. Figure 3.35. Scale Example 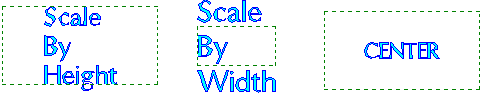
Stretch . This option changes the text aspect ratio and size. The spaces between the characters are changed by the same factor, thereby maintaining the same text to space ratio as before. Stretch can be done to fit the frame's width, height, or both to form a rectangular block. Figure 3.36. Stretch Example 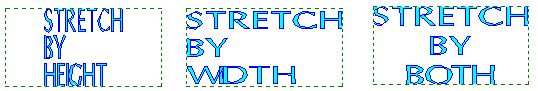
Spaces . This option does not change the text size or aspect ratio, but recalculates the spaces between the characters and between the lines in order to adjust to the frame's rectangle. Spaces can be set to fit the frame's width, height, or both. Figure 3.37. Spaces Example 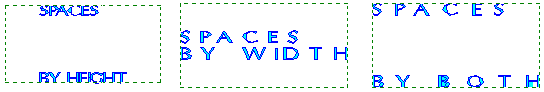
Approve the dialog box settings by pressing |
|||||||||||||||||||||||||||||||||||||||||
 |
Sets the marked text on straight line. |
|||||||||||||||||||||||||||||||||||||||||
 |
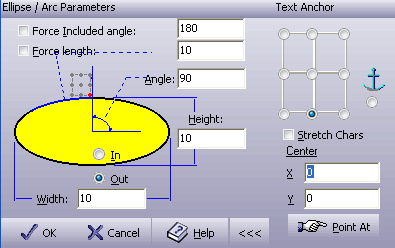
Change the physical location of any character group, and fit the marked lines on the contour of a circle or an ellipse. The Advanced Mode Button Figure 3.39. Position On Ellipse, Advanced Mode 
When all the parameters are set, click the button and use the mouse to select the ellipse location, or set the Center X and Y fields and press the button. |
|||||||||||||||||||||||||||||||||||||||||
 |
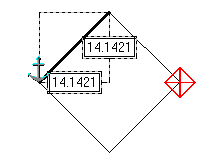
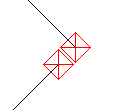
Setting the marked lines of text along a curve or between two curves: Figure 3.40. Fit on Curve

Figure 3.41. Fit on Curves 
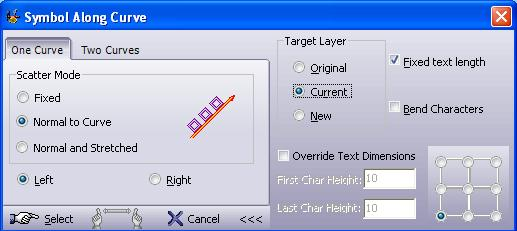
Figure 3.42. Symbol Along Curve, One Curve 
Table 3.1. Scatter Mode
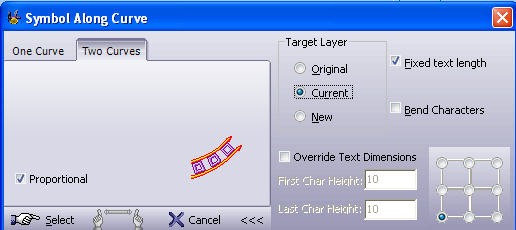
Figure 3.43. Symbol Along Curve, Two Curves
 The system stretches the text to fit into the space between two curves. The two curves have to be chained at the same direction. Figure 3.44. Fit Between Two Curves 
Figure 3.45. Symbol Along Curve, Advanced Mode

Table 3.2. Target Layer
|
|||||||||||||||||||||||||||||||||||||||||
 |
The Stack option is used for multiple text items such as serial numbers and numbers or series of similar signs. The stacks are divided into groups, each of which is a series of sequential characters on the same text line. A data field may be marked and unmarked in the whole only. Adding Data Fields . The stack data fields may be added. To add a Stack data field:
Stack Editing . Any Stack data field, marked or unmarked, can hold up to 64 KB of text data, which will be exploded later into the layout. To edit Stack data fields, use the Stack Definition dialog box:
Stack Explode . Stack data fields will be exploded to enter the correct character strings into the layout in the desired text parameters and alignments. Only marked stack data fields, text and geometries will be exploded. Figure 3.51. Explode 
|
|||||||||||||||||||||||||||||||||||||||||
 |
Create straight and circular linear scales and dials. On linear scales, the values between increments are constant (as opposed to logarithmic scales). You can create any kind of linear measurement scale with the rulers option. The scales are divided into two major parts, the ruler and the text. The Ruler . The Ruler is a closed contour, which defines the ruler shape. The shape may be defined as linear (straight) or circular (arc or circle). The basic parts of the ruler are the Baseline, which is the ruler contour itself, and the Ticks, which are the little "clock marks" on the ruler. The ticks may be divided into three nested levels. Each level has its own length and width. Repetitions indicate how many areas will be defined by this level according to the previous one. For example, a repetition value of 3 on the 2nd level defines that the distance between any two ticks on the 1st level will be divided by 3 for the second level ticks. The following examples show different rulers: |
| |
|
|
| Help Menu |  |
File Menu |
![[Note]](../images/note.png)


 The characters keep their original angle.
  The characters centerline is always normal to the
curve. No collision check is made between sequential characters.
The characters centerline is always normal to the
curve. No collision check is made between sequential characters.  The character base size is fixed, and the top
size is changed according to the curvature in order to prevent neighbor
character collision.
The character base size is fixed, and the top
size is changed according to the curvature in order to prevent neighbor
character collision. 


